Social Media Analytics Dashboard

1. Project Overview
This project focuses on analyzing the performance of the Irfan's View YouTube channel using Power BI to uncover insights such as top-performing videos, audience engagement, and growth trends. The goal is to help refine content strategy and improve audience targeting based on data-driven insights.
2. Data Gathering Process
Data was collected using the YouTube Data API and Python to automate the extraction of key metrics. The data was then exported as CSV files, including information on views, likes, comments, watch time, and audience demographics. Python scripts were used to clean and preprocess the data for seamless integration into Power BI.
3. Key Metrics
- Total Views
- Top 10 Performing Videos
- Audience Demographics
- Engagement Rate
4. Key Insights
- High engagement observed on videos
- Significant growth spikes during specific months, indicating successful content releases or trends.
5. Power BI Visualizations
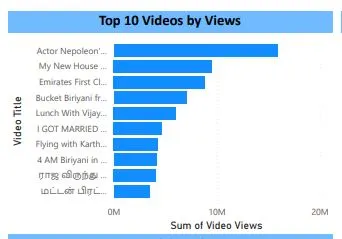
Top Performing Videos
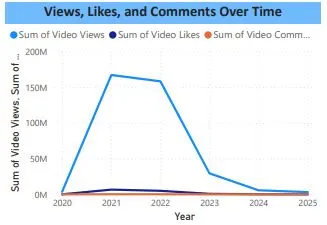
View and likes over the time
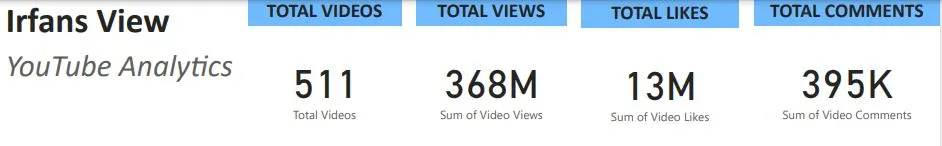
Overall Analytics
6. Conclusion
The analysis provided actionable insights for refining the content strategy, focusing more on food reviews and trending topics. Understanding audience demographics and engagement patterns can help in planning future content and marketing efforts effectively.
Take a look at my other projects to see how I address real-world problems using data.